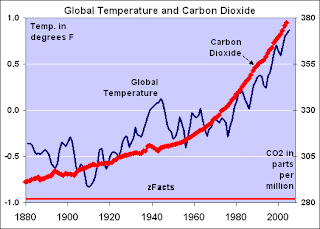
1.The horizontal line is showing the dates on how its going up by 100 years. It shows 1880 to the year 2000.
The vertical line shows the temperature in degrees F. The units are -1.0 to up to 1.0.
3. It doesn't say where they got the data from.

No comments:
Post a Comment